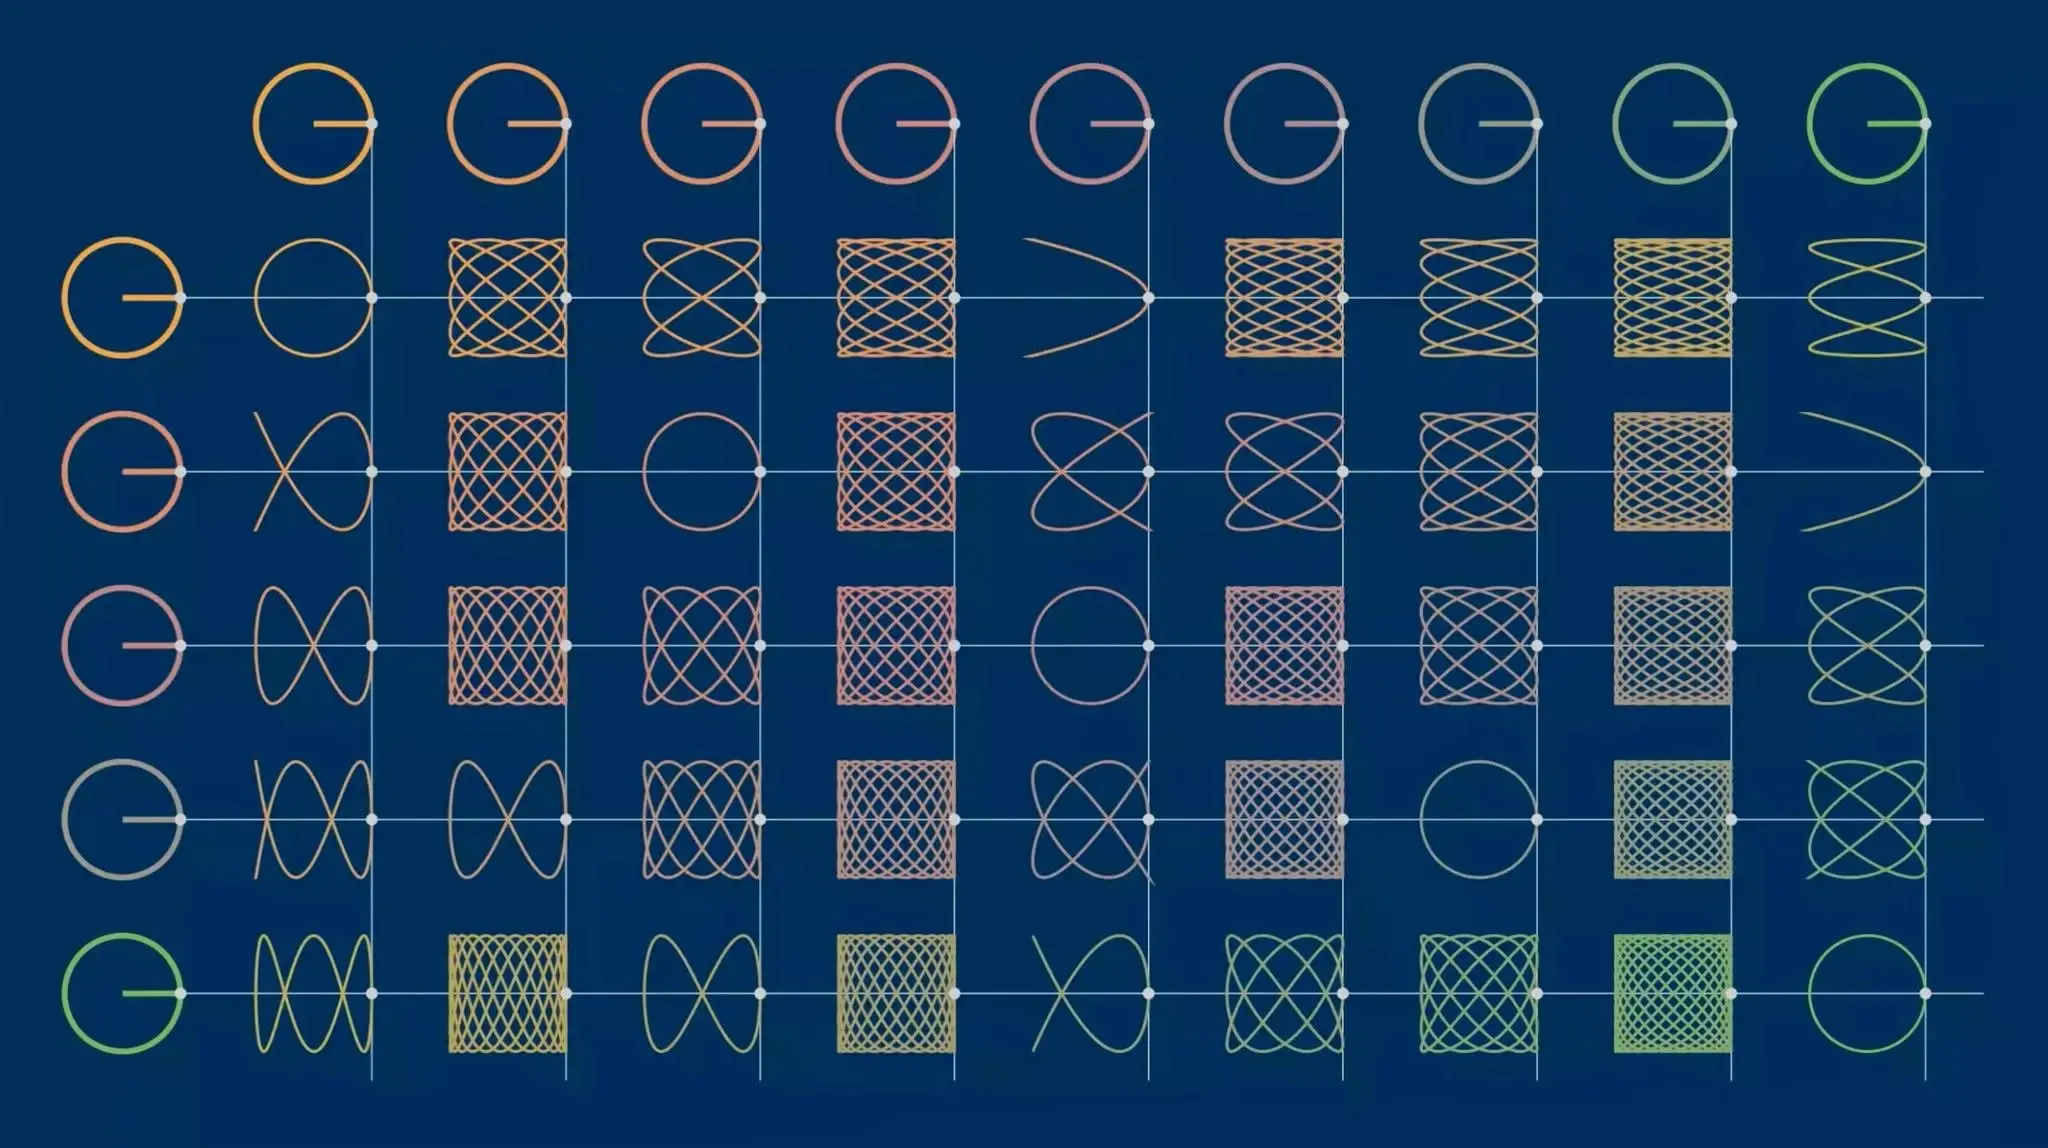
The video above is exactly that table, built one cell at a time. Two circles turn at the edge of the frame, a point is tied to both of them, and the pattern the point traces out changes completely when one circle is asked to turn twice as fast as the other. The idea started with tuning forks in 1857 and today it does work in recording studios, in lidar sensors and in the route of an observatory 1.5 million kilometres away.
The logo of the ABC, Australia’s public broadcaster, is a single looping line, and the line that staff graphic designer Bill Kennard submitted in 1965 is exactly the pattern an oscilloscope shows when one sine wave goes into its X input and another at three times the frequency goes into its Y input. Kennard was paid £25 for the design, and the line has sat at the centre of the logo ever since. Its name is the Lissajous curve.
The reason I like this curve is that beyond being a handsome shape it works like a measuring instrument. Three questions you can ask about two signals, how their frequencies compare, what phase difference sits between them and how far they have slipped apart, all have their answers written into the shape of the line, and you do not even need to calculate anything to read them.
Two pendulums, one point
Picture a point doing two things at once. The side-to-side motion traces a sine wave like a pendulum while the up-and-down motion traces a second sine at its own frequency, and the point draws the combination of the two.
x = A sin(a·t + δ)y = B sin(b·t)
Here a and b are the frequencies of the two motions and δ is the phase difference between them. A and B only set the width and height of the pattern, while what actually changes the shape is the ratio of a to b, together with δ. With a ratio of 1 to 1 and no phase difference the point goes back and forth along a straight diagonal. Push the phase to 90 degrees and the line opens up, becoming a circle if the amplitudes are equal, and at every angle in between you get a tilted ellipse. A ratio of 1 to 2 gives something like a figure eight, and 2 to 3 gives the pattern turning on the screen above.
If the ratio is a ratio of two whole numbers, the point eventually returns to where it started and the curve closes. If the ratio is irrational the point never runs along the same path twice and over time it comes close to every corner of the rectangle it lives in. That second case comes back at the end of this piece, in the orbit of Gaia.
Reading the frequency ratio off the pattern does not even need a ruler. Count how many times the curve touches the top edge of its frame, then count how many times it touches a side edge. As long as the phase does not land on a special value where the curve doubles back over itself, the ratio of those two counts is the ratio of the vertical frequency to the horizontal one. In the ABC logo the curve touches the top edge three times and a side edge once, and that is exactly the 3 to 1 that Kennard fed into his oscilloscope.
Bouncing light off a vibrating mirror
Lissajous was not the first to study these patterns. The American Nathaniel Bowditch produced the same figures in 1815 with a compound pendulum, which is why they are sometimes called Bowditch curves, and Bowditch is better known today as the author of The New American Practical Navigator, a book still in print.
Jules Antoine Lissajous, who gave the curve its name, came at it through sound. Because sound vibrations are too fast to follow with the eye, Lissajous proposed in 1855 to throw a beam of light reflected from the vibrating body onto a screen, with the aim of seeing the waveform and tuning precisely without using the ear at all. Each fork carries a small mirror on one prong and a counterweight of equal mass on the other, and light bouncing off the mirror of the first fork passes to the second, set at right angles to it, and on to the screen. We see a continuous line on the screen only because the eye holds on to an image for a short moment, which means the curve is really a single spot of light running round very fast.
When Lissajous described the method in an 85-page paper in 1857 he was teaching at the Lycée Saint-Louis in Paris. That same year, as John Tyndall was preparing to repeat the experiments in London, Lissajous came over himself and gave the demonstration at the Royal Institution, and in 1873 he received the Lacaze Prize for his optical observation of vibrations. Hermann von Helmholtz, for his part, used Lissajous’s vibration microscope to work out how a violin string vibrates. In the century that followed, the same curves were drawn mechanically by the harmonograph, a cousin of the geometric lathes that were engraving the same kind of figure into metal, and once computers arrived they moved into screensavers.
The eye catches what the ear misses
What Lissajous was really after was tuning. When the French government set up a commission in 1858 to fix a standard for concert pitch, Lissajous sat on it alongside Hector Berlioz and Gioachino Rossini.
The logic of the method is simple. Take two forks that are supposed to vibrate at the same frequency. If the frequencies are exactly equal, the ellipse on the screen stands still. If there is a small difference between them the phase slides over time, the ellipse slowly starts to turn, narrows down to a line and then opens again. However many full turns the pattern makes per second, that is the difference between the two frequencies in hertz. Next to a 440 Hz reference, a fork at 440.1 Hz turns the pattern once every ten seconds, and following a change that slow by ear is much harder than watching it on a screen.
Fork makers paired an unfinished fork with a known standard and watched the pattern, filing metal off the tips of the prongs to raise the frequency and off the inside of the U-shaped yoke to lower it, and got down to a precision the ear could never reach.
Draw it yourself
Change the horizontal and vertical frequencies and count the times the curve touches the edges. Leave the two frequencies equal and play with the phase, and two orange marks appear on the screen. Call the height where the ellipse crosses the vertical axis y₀ and its highest point ymax, and the phase difference comes out of sin φ = y₀ / ymax. In an oscilloscope’s X-Y mode the phase relationship between two signals shows up directly as a Lissajous curve, and those two lengths measured on the screen are enough to give you the phase. Turn up the frequency offset and the pattern starts turning, just as it did on Lissajous’s forks.
Lissajous in everyday life
The curve’s name rarely comes up, but in plenty of places where someone needs to know what two oscillations are doing relative to each other, it is being drawn inside a screen or a mirror.
The phase display in the recording studio
Recording studios use a display called a goniometer to watch panning, stereo width and mono compatibility, and that display is the familiar Lissajous setup itself. The left and right channels drive the two axes of an oscilloscope, and equipment built for audio rotates the picture by 45 degrees. So if the two channels are identical, which is to say the sound is mono, you see a vertical line. As the pattern spreads towards the horizontal the two channels become more different, and that points to possible trouble with mono compatibility.
A song is not always heard through two speakers. In nightclubs the loudspeakers are so far apart that many mixing engineers combine the two channels at least partly, and in that combination an out-of-phase signal disappears completely. If one of the cables has its polarity reversed, the two channels are the same but with opposite sign, the correlation drops to −1 and the sound vanishes on a mono output.
The sneakier case is two microphones standing at different distances from the same sound. Sound travels about 343 metres per second in air, so a delay of 1 millisecond corresponds to a 34-centimetre difference in distance, and that delay wipes certain frequencies out of the mono sum. On the display below, you can watch the vertical line open into a cloud as the delay goes up, and see the mono level drop.
The signal is the sum of four sines at 97, 211, 347 and 523 Hz. The left channel alone draws a line leaning up to the left, the right channel alone one leaning up to the right.
Watching music on an oscilloscope
Jerobeam Fenderson and Hansi Raber’s album Oscilloscope Music works the other way round, with sounds shaped by hand so that they form pictures when played into an old analogue oscilloscope in X-Y mode. On the 2016 album the left channel moves the beam horizontally and the right channel moves it vertically, so what you hear in your headphones is also a set of drawing instructions. In 2024 Squarepusher sent his newsletter subscribers a file called XY.wav, and when it was plotted on an oscilloscope the name of his new album, Dostrotime, appeared on the screen.
Lidar, laser projectors and smart headlights
The most familiar way to sweep a laser beam over an area is to go line by line, the way old tube televisions did. With tiny MEMS mirrors that comes at a price, because line scanning means one axis of the mirror has to be forced along against its natural frequency. In Lissajous scanning the mirror oscillates at or near its own resonance on both axes, and that lets small actuators reach high speeds on little power.
In Fraunhofer’s lidar camera the slow axis of the mirror oscillates at 525 Hz and the fast axis at 16.4 kHz, and together they sweep an area of about 1.5 by 1.5 metres at a distance of 2 metres. In a prototype built for an adaptive car headlight, a 2-millimetre mirror oscillating at 17.328 kHz and 4.81 kHz draws a blue laser onto a phosphor plate, and the plan is to use the same mirror for lidar too.
Gaia’s shadow-dodging orbit
The European Space Agency’s Gaia observatory travelled on a Lissajous orbit around the L2 point, 1.5 million kilometres from Earth, going round about once every 180 days. The orbit’s amplitudes were 120,000 and 340,000 kilometres in the ecliptic plane and 180,000 kilometres perpendicular to it.
The L2 point itself sits permanently in Earth’s shadow. Around L2 there is a zone roughly 13,000 kilometres in radius where the Sun is always blocked by Earth, and Gaia’s thermal balance was so delicate that it was never allowed to enter the shadow.
This is where it makes sense that the orbit is a Lissajous. Around L2, the spacecraft’s oscillation in the ecliptic plane and its oscillation perpendicular to the plane have periods very close to each other but not equal. Since the ratio is not a ratio of two whole numbers, the curve never closes, the pattern shifts a little with every loop and over the years it drifts towards the shadow in the middle. Gaia’s shadow-free path ran out at the end of its planned lifetime, and without intervention it would have slipped partly into Earth’s shadow in August and November of that year, so the team named the manoeuvre after Gary Whitehead, a colleague they had lost only a month before. The 14-metre-per-second push planned for July 2019 was calculated to keep Gaia working out of Earth’s shadow through to 2025.
Where to go next
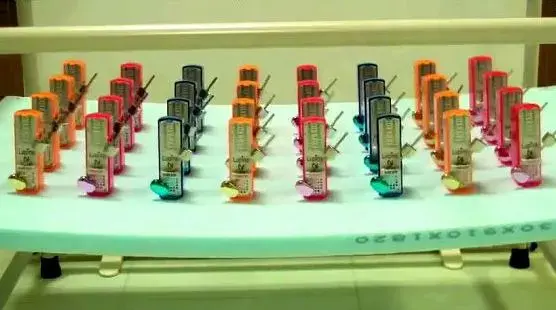
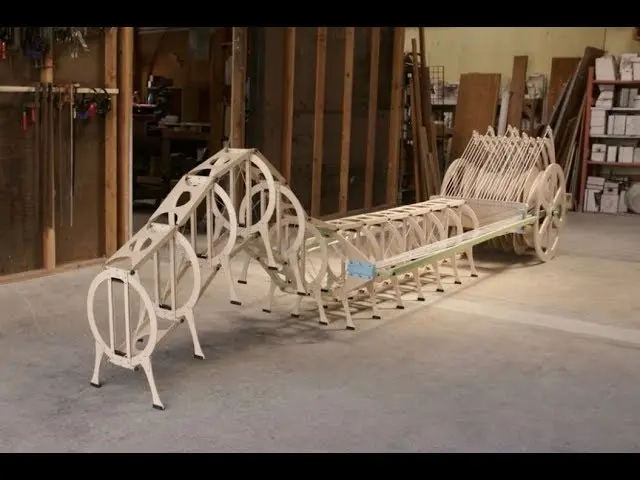
Two oscillators that are nearly but not quite in step is a story that keeps turning up: whole hillsides of fireflies settle into one rhythm by the same arithmetic that makes a mistuned fork rotate its ellipse. And for a machine built to put a wave where the eye can see it, Reuben Margolin’s walking caterpillar is a sine curve rebuilt in plywood.
Video · Lissajous Curve Table animation