Physics · Mathematics · Roger Penrose · 6 min read
Inside Roger Penrose's notebook
A set of photographs circulating online shows the handwritten notebooks of Sir Roger Penrose — Nobel laureate, inventor of twistor theory, and the person who corresponded with Escher and changed how we think about aperiodic tilings, black holes, and consciousness. The pages show him thinking, not publishing. There is a difference.
These photographs have been circulating online for years. They surfaced on a Tumblr page around a decade ago, which cited a British library archive as its source — but that page is gone, and so is the library link. When the images appeared on Hacker News in November 2023, the first question in the comments was: what is the source? Nobody could answer it definitively. The images link back to an Amazon author page. No original archive, no museum, no publication has been identified as the definitive source of these photographs.
If you know where these came from — which library, which exhibition, which book — we genuinely want to hear from you. The note at the bottom of this article has a contact address. We'd like to credit the right institution.
These photographs were first encountered on a Tumblr page approximately ten years ago. The Tumblr post cited a British library archive as its source. Both the Tumblr page and the library page are now offline. If you can identify the original source — a specific archive, collection, publication, or exhibition — please write to us at hello@abakcus.com so we can credit it properly.
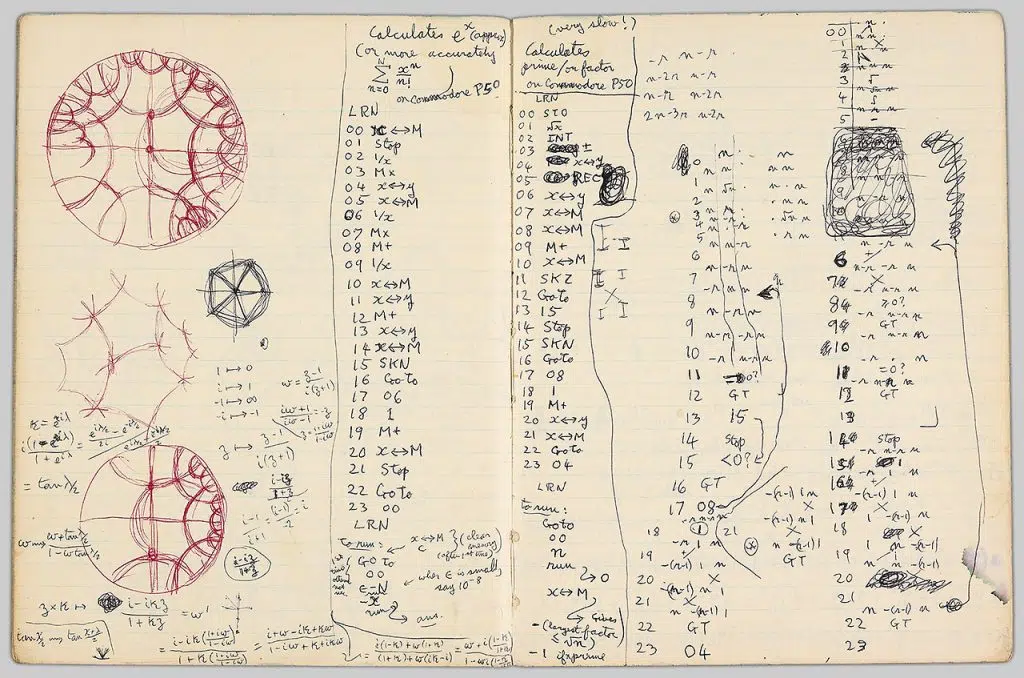
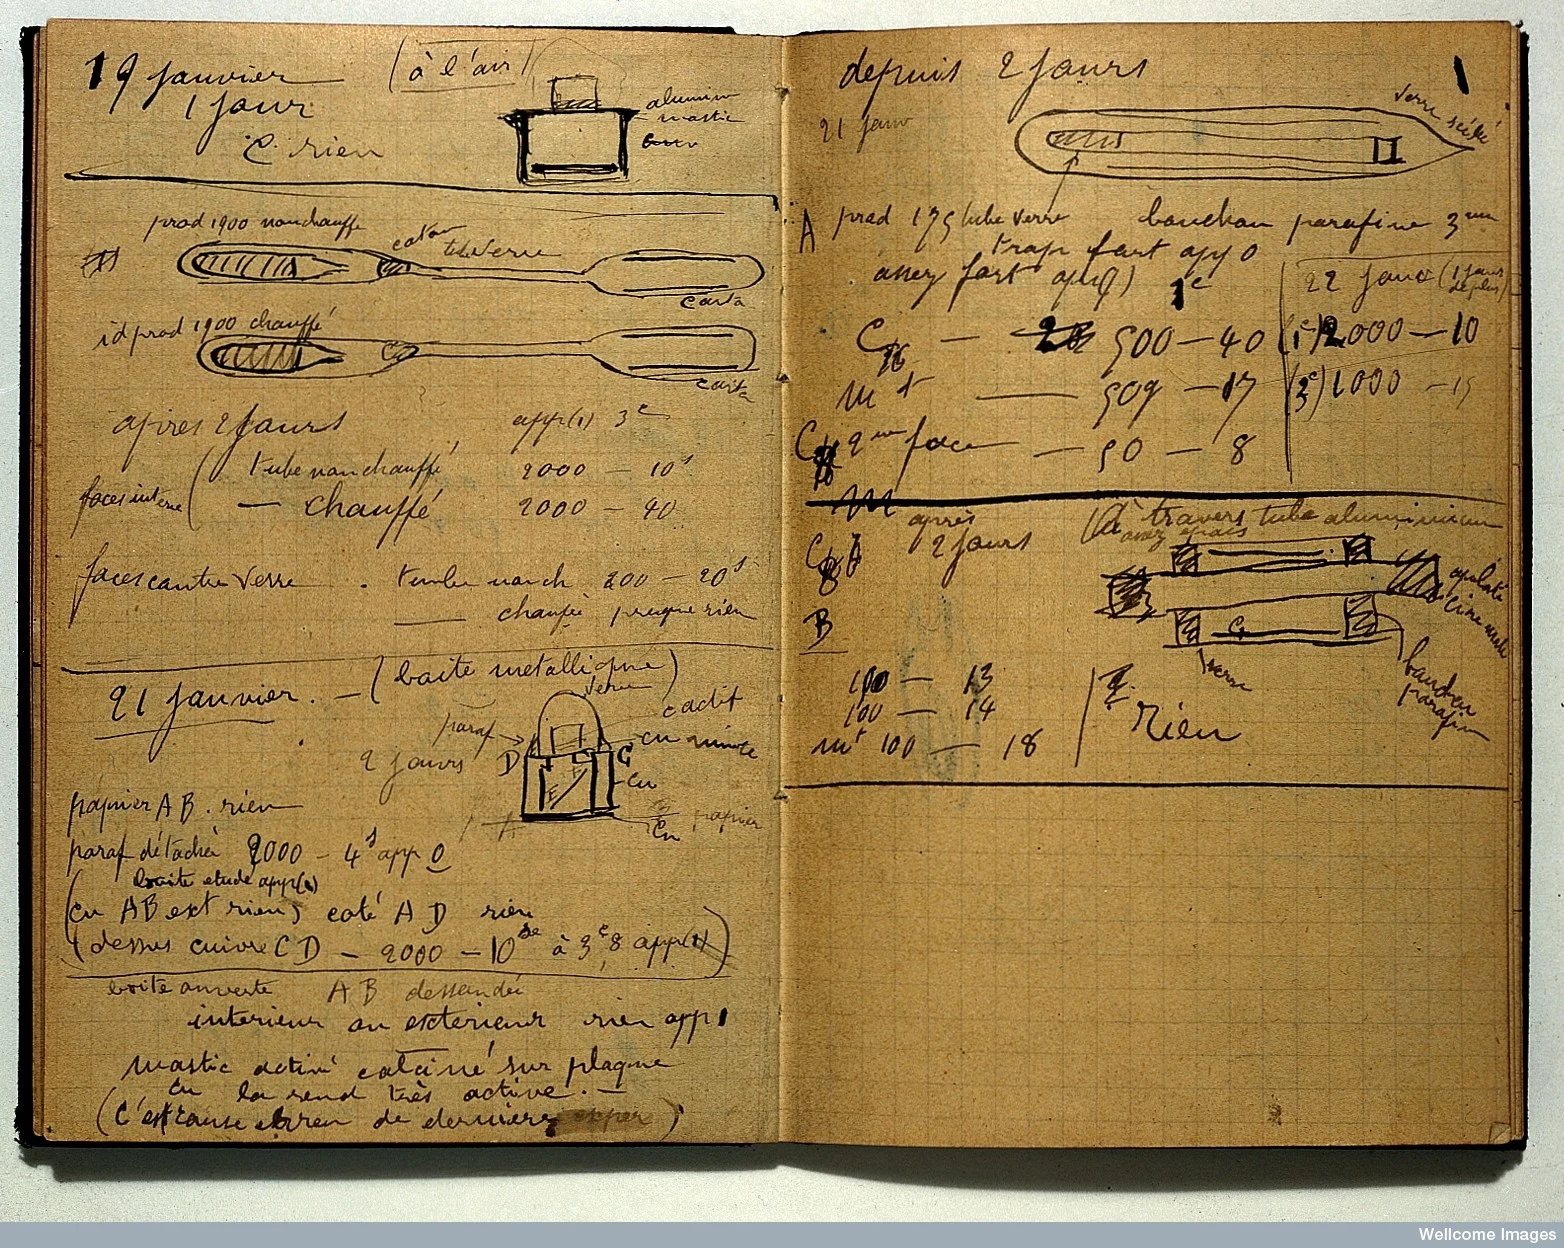
The first spread stops you. On the left, two large red-ink diagrams of hyperbolic circles — the kind that appear in the theory of conformal mappings and in Penrose's long-running obsession with the geometry of complex space. Below them, a smaller dodecahedron sketch. Between the diagrams, fragments of equations relating to conformal transformations: = tan½z, references to continued fractions, limits as i approaches infinity.
On the right half of the spread: column after column of numbered instructions for a Commodore P50 programmable calculator. This is a 1978 pocket device with a tiny keyboard and a programmable memory measured in dozens of steps. Penrose is writing routines to calculate prime factors and approximate e — "calculates ex (approximately), or more accurately, Σ xⁿ/n! on Commodore P50." The header adds: "very slow!"
The Commodore P50 detail is not incidental. Penrose was using consumer electronics as a scratch pad for number theory. The gap between the red hyperbolic diagrams and the step-by-step calculator loops is not a gap at all — it's the same person exploring the same territory through different instruments.
The Commodore P50 detail is not incidental. According to a comment on the Hacker News thread about these photographs, the Commodore P50 was a programmable calculator from 1978. Penrose was using consumer electronics as a scratch pad for number theory. The gap between the red hyperbolic diagrams and the step-by-step calculator loops is not a gap at all — it's the same person exploring the same territory through different instruments.
The tiling pages
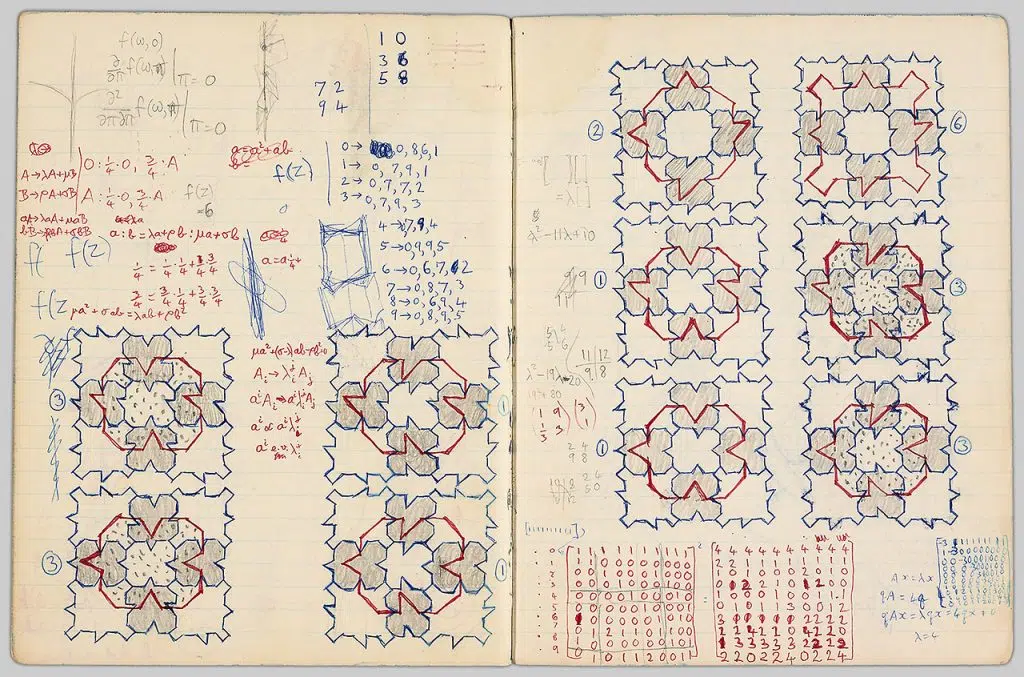
The second spread is the one that circulates most widely, and for good reason. The right half of the spread shows six hand-drawn tiling configurations — interlocking kite-and-dart shapes in blue and red, each variant slightly different, numbered and compared. These are working sketches of what would become Penrose tilings: the aperiodic patterns that tile the plane infinitely without ever repeating, exhibiting fivefold rotational symmetry that Euclidean geometry had previously ruled impossible for tilings.
Penrose discovered aperiodic tilings in 1974 — reducing the number of required tile shapes from the thousands that earlier researchers had needed, down to two. The tilings subsequently revealed that the geometry of quasicrystals — a form of matter whose existence was not confirmed until 1984 — had been sitting in Penrose's notebook a decade earlier.
The left half of this spread shows the algebraic machinery behind the tilings: eigenvalue equations, substitution rules for inflation and deflation of tile shapes, binary transition matrices. The bottom of the page has two large tables of 0s and 1s — substitution matrices that encode how one generation of tiles generates the next. This is the formal structure underneath the visual patterns on the right. Both halves of the spread are the same work.
Penrose's work on aperiodic tilings is a cornerstone of mathematical physics. See also: Unit Circle for more on geometric visualization.
Polyhedra, spin networks, graphs
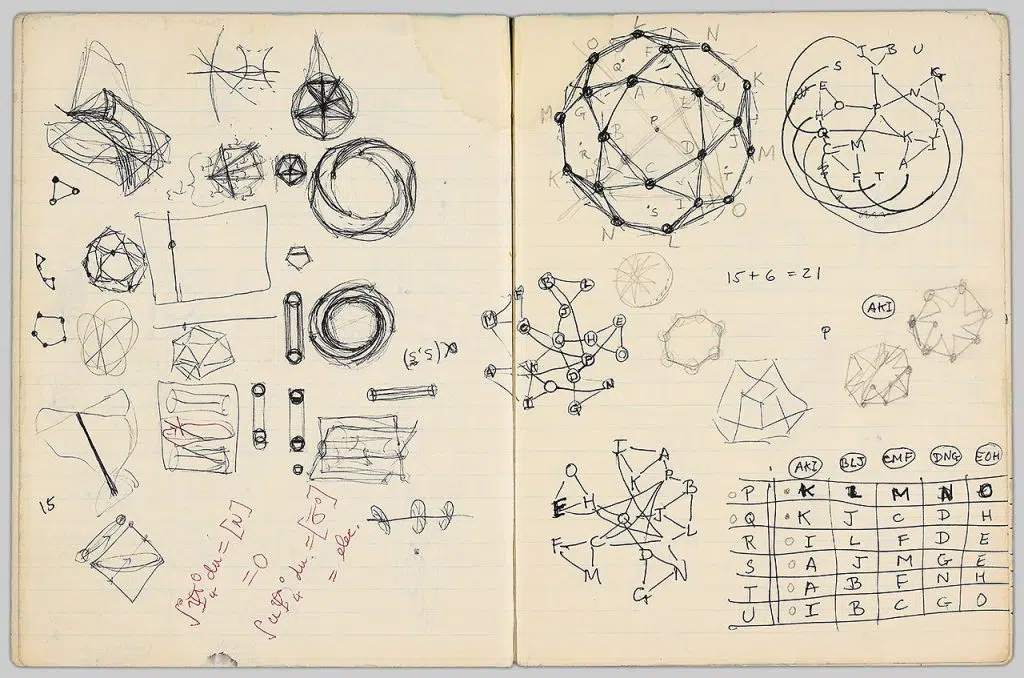
The third spread is the most exploratory. The left page is a study in three-dimensional forms: icosahedra, dodecahedra, and less standard polyhedra drawn from multiple angles. Several are sketched in rapid sequence — the same object rotated, or a related object derived from it. Alongside them, tightly wound spiral curves and what appear to be toroidal surfaces, drawn with the kind of repetitive hatching that comes from sitting with a problem long enough to fill the page around it.
The right page shifts register. Two large graph diagrams with labeled nodes — lettered vertices connected by edges, the structure of a combinatorial object being worked out. Below them a table that looks like a matching or assignment problem: rows labeled P, Q, R, S, T, U; columns labeled with abbreviated names; cells filled with letters. This is the kind of object that appears in Penrose's work on spin networks — his 1971 combinatorial approach to quantizing geometry, which later became foundational in loop quantum gravity.
In the middle of the right page, almost incidentally: 15 + 6 = 21. No context, no explanation. A number that mattered at that moment and was written down.
Cayley algebra and black holes
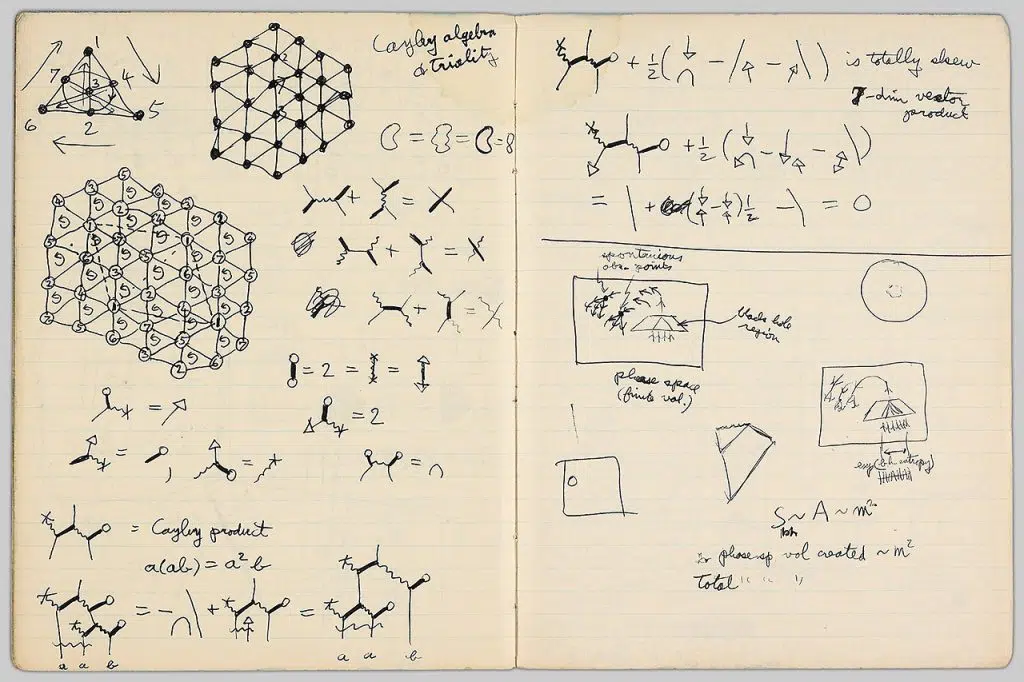
The fourth spread is the densest. Top left: a labeled graph titled "Cayley algebra triality" with the equation 𝔾 = 𝔾 = 𝔾 = 8. This is the exceptional non-associative algebra — the octonions — whose triality symmetry has been a recurring object of fascination in mathematical physics. Below it, a larger node-and-edge diagram with numbered vertices, working out the structure of the Cayley algebra explicitly.
The middle of the left page introduces Penrose's own graphical notation for spinors — the tensor diagram notation he invented in 1971, where lines represent indices and shapes represent tensors. The page shows the basic identities: how spinors multiply, what combinations vanish, what the Cayley product reduces to. The notation looks like a visual language, because it is one.
The right half of the spread pivots completely. Rough diagrams labeled "spontaneous obs. points," "black hole region," "phase space (finite vol.)," with an unlabeled circle representing a black hole and an equation S ~ A ~ m² — the Bekenstein-Hawking entropy formula, relating a black hole's entropy to its surface area. Penrose shared the 1988 Wolf Prize with Stephen Hawking for the singularity theorems; these sketches are part of the same decades-long investigation into what happens at the boundary of spacetime.
These notebooks show the sustained, lateral, material practice of someone who thinks with his hands on paper. The theory is being located, not illustrated.
What these notebooks show, collectively, is not a genius in a single moment of insight. They show the sustained, lateral, material practice of someone who thinks with his hands on paper. The red-ink hyperbolic circles are not illustrations of a theory that already existed — they are the theory being located. The tiling sketches are not reproductions of a known result — they are the result being found. The spinor notation is not a diagram of an equation — it is a way of seeing an equation that makes certain moves possible and certain errors impossible.
Penrose has described his own relationship to visual and spatial intuition throughout his career: in his books, in interviews, in the design of the notation that bears his name. The notebooks make that description concrete. This is what it looks like to think geometrically, over time, in ink.
Photographs source: unknown — originally cited to a British library archive, now offline. If you can identify the original source, please contact us at hello@abakcus.com
References: Roger Penrose on Wikipedia · en.wikipedia.org/wiki/Roger_Penrose
Penrose graphical notation · Penrose graphical notation
Penrose tiling · Penrose tiling