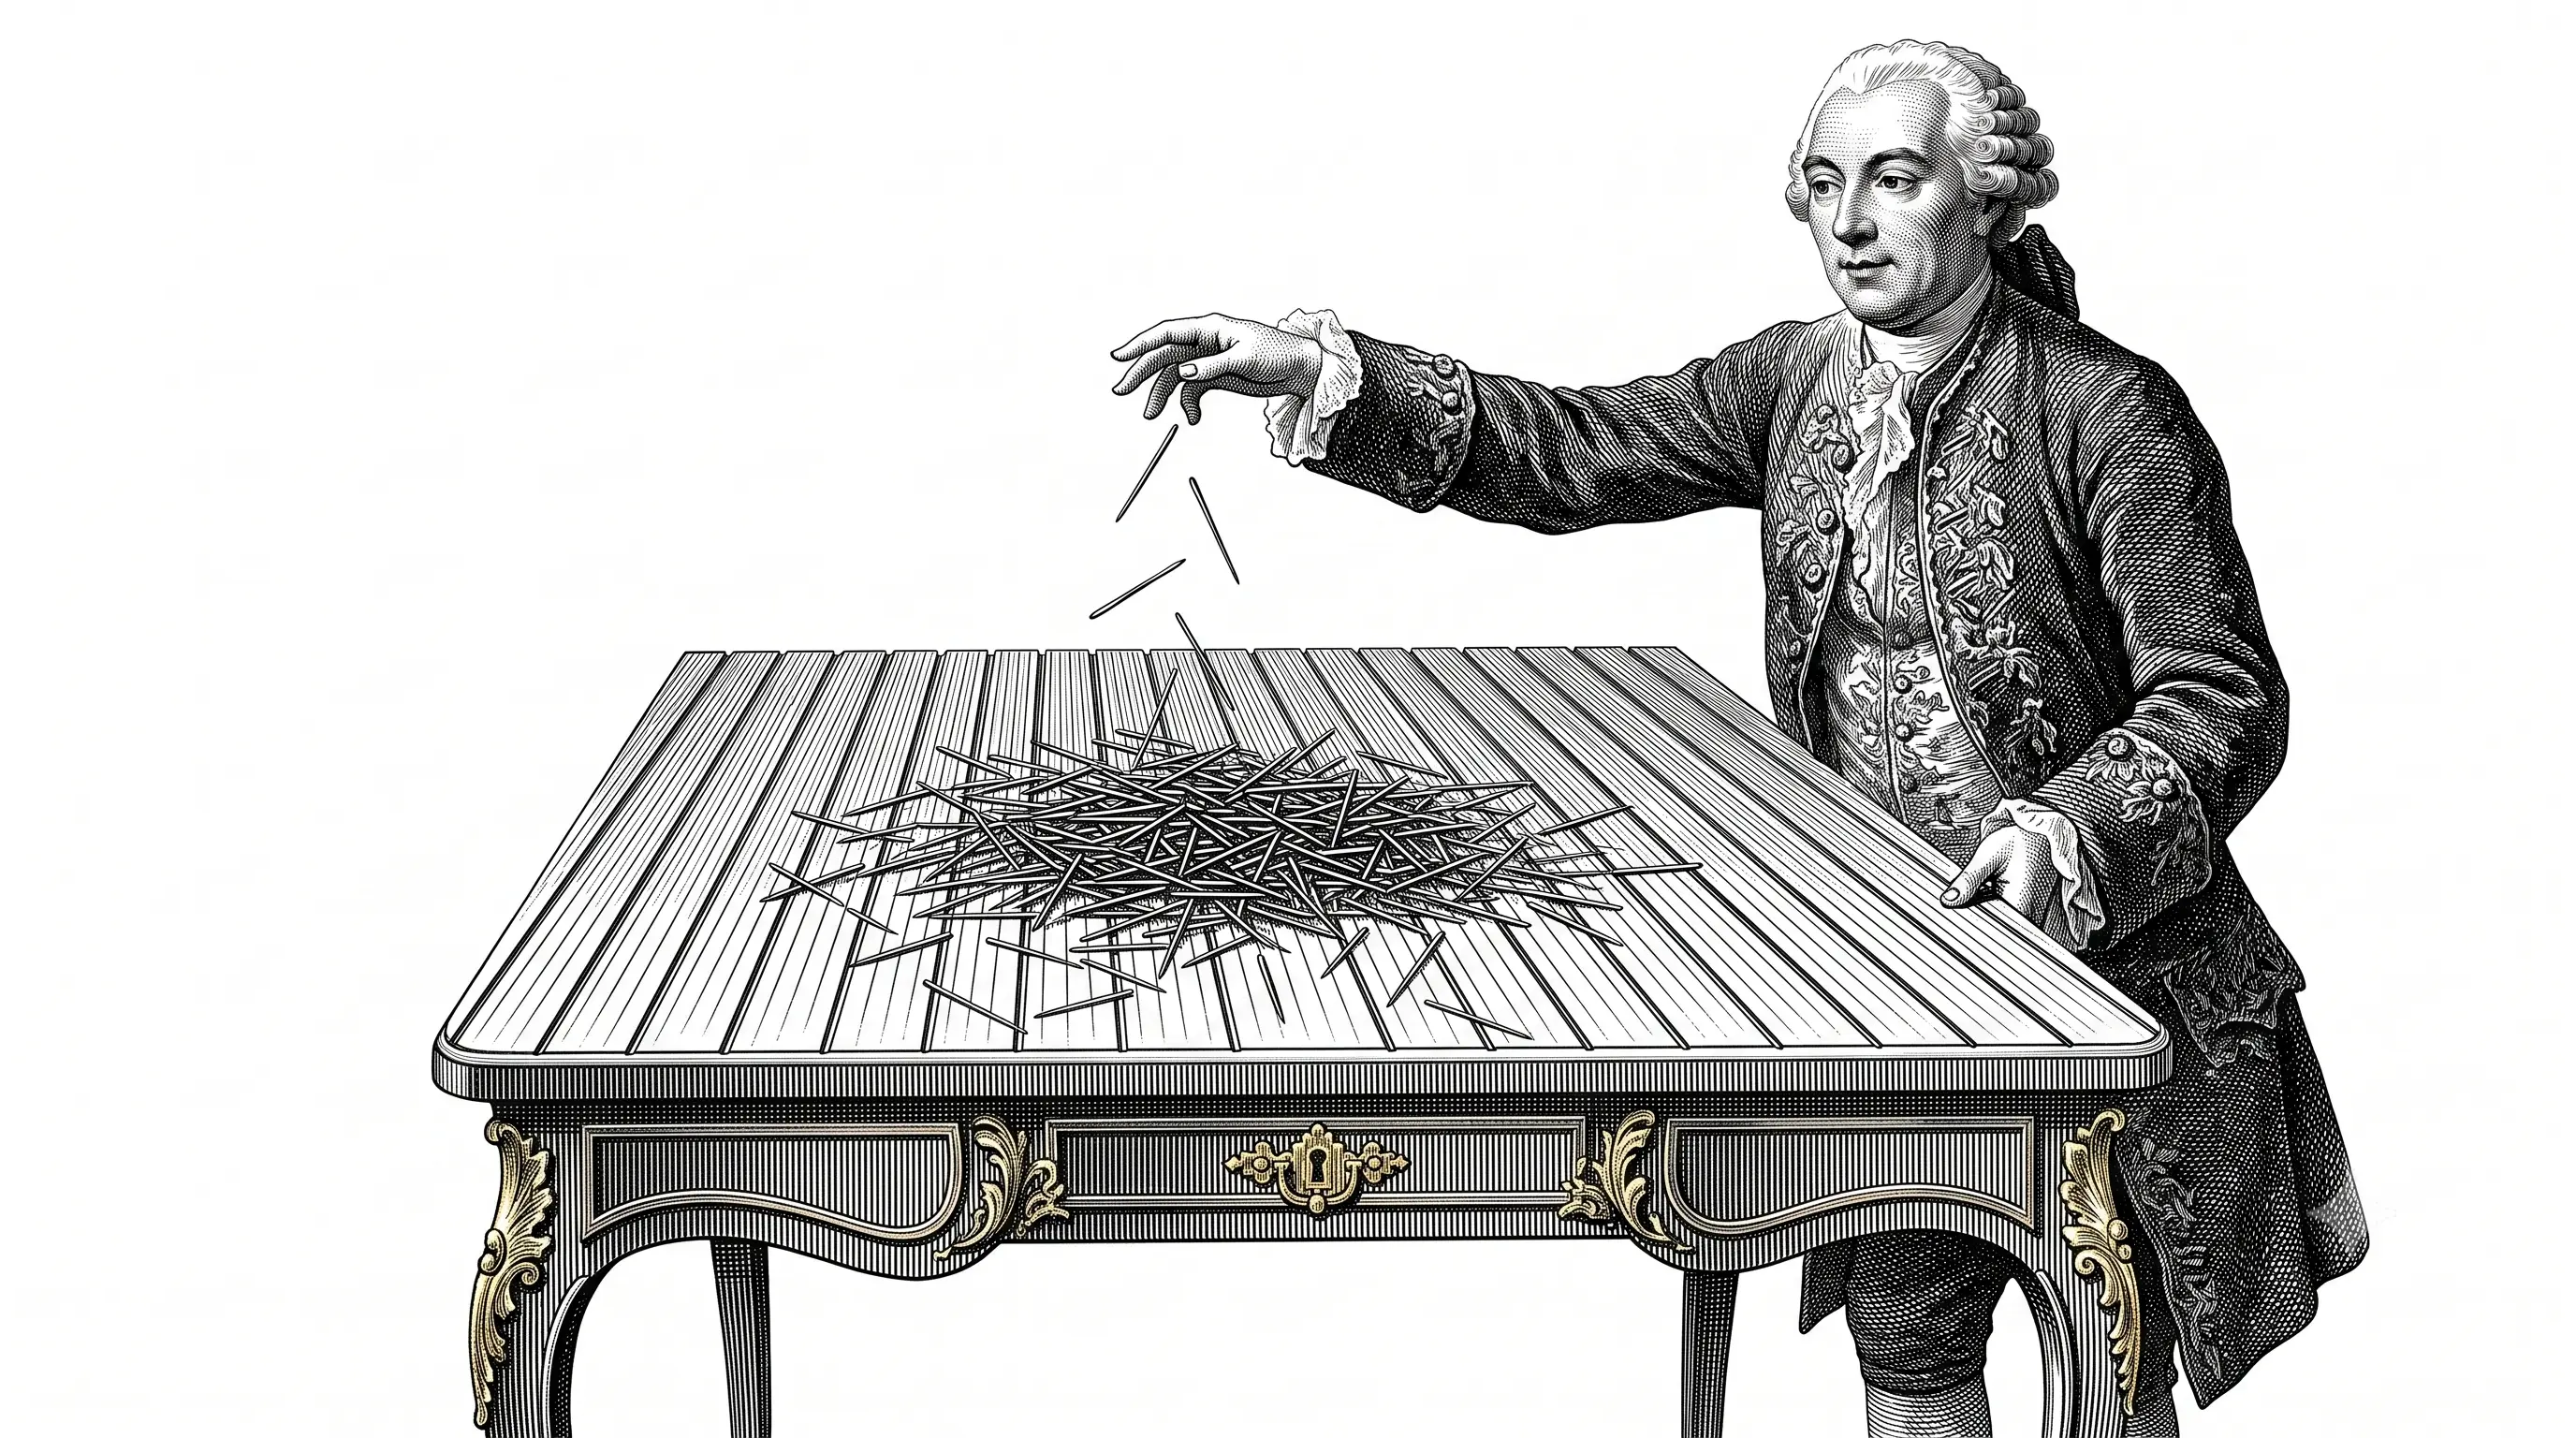
Picture a wooden floor. The planks run parallel, the seams between them evenly spaced. In your hand is a needle, shorter than a plank is wide. You toss it into the air and it lands. Here is the question: what is the probability that the needle comes to rest across one of the seams?
The question sounds like a carpenter’s. The answer comes from one of mathematics’ least expected corners: the probability is 2L/πd, where L is the length of the needle and d is the distance between the lines. And yes, there it is in the denominator: π. Right at the center of a problem with no visible connection to circles, roundness, or curvature, the number π is sitting quietly.
This is only the beginning. Turn the formula inside out and you are holding an instrument that measures π experimentally: toss enough needles, count the crossings, divide, and out comes π. For the first time in human history, a mathematical constant could be hunted down not with pencil and paper but with a random physical experiment. The oldest known ancestor of the Monte Carlo method, used today in everything from nuclear physics to finance, is this needle.1
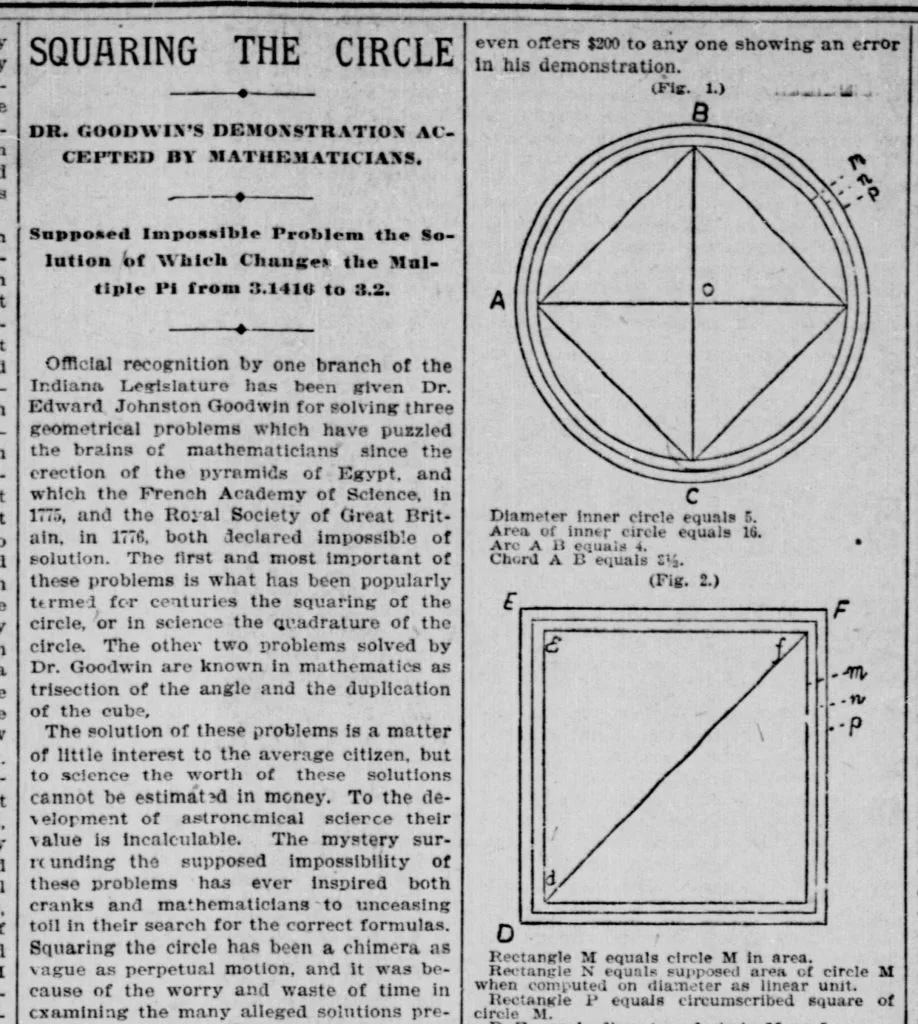
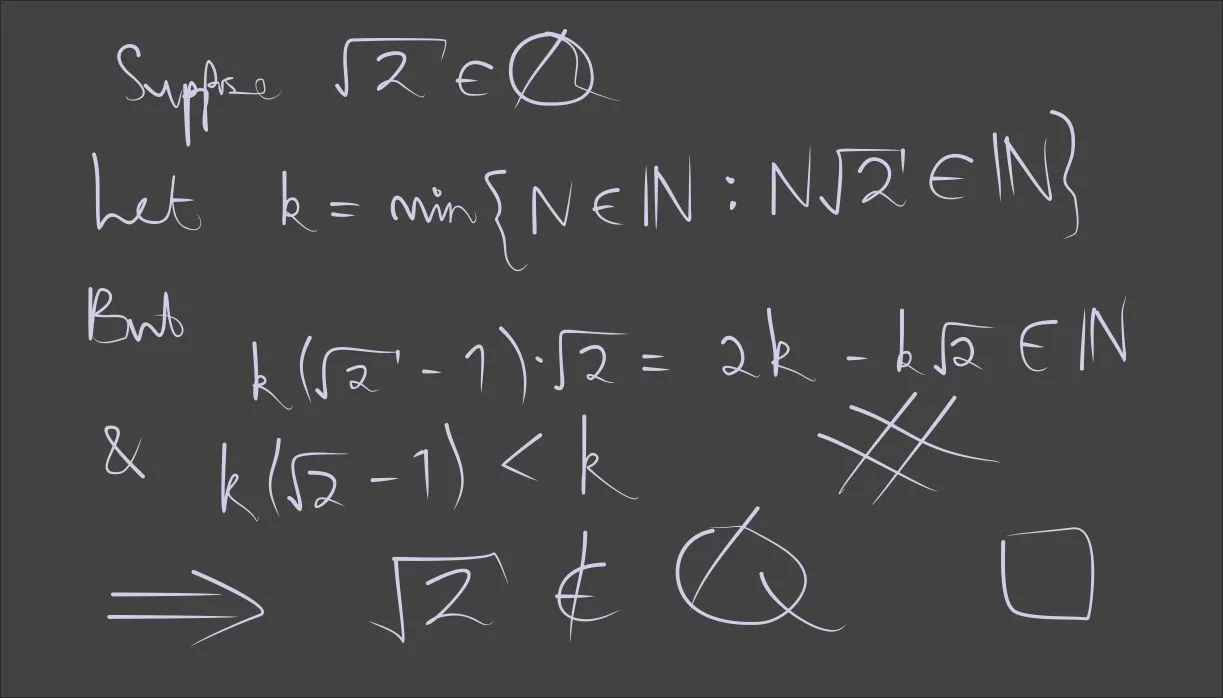
On Abakcus this sits alongside the Indiana legislature’s attempt to vote π into a different value and a proof that √2 is irrational — two other reminders that certain numbers do not negotiate.
I · The Man
The Count, a Forty-Volume Encyclopedia, and a Flooring Game
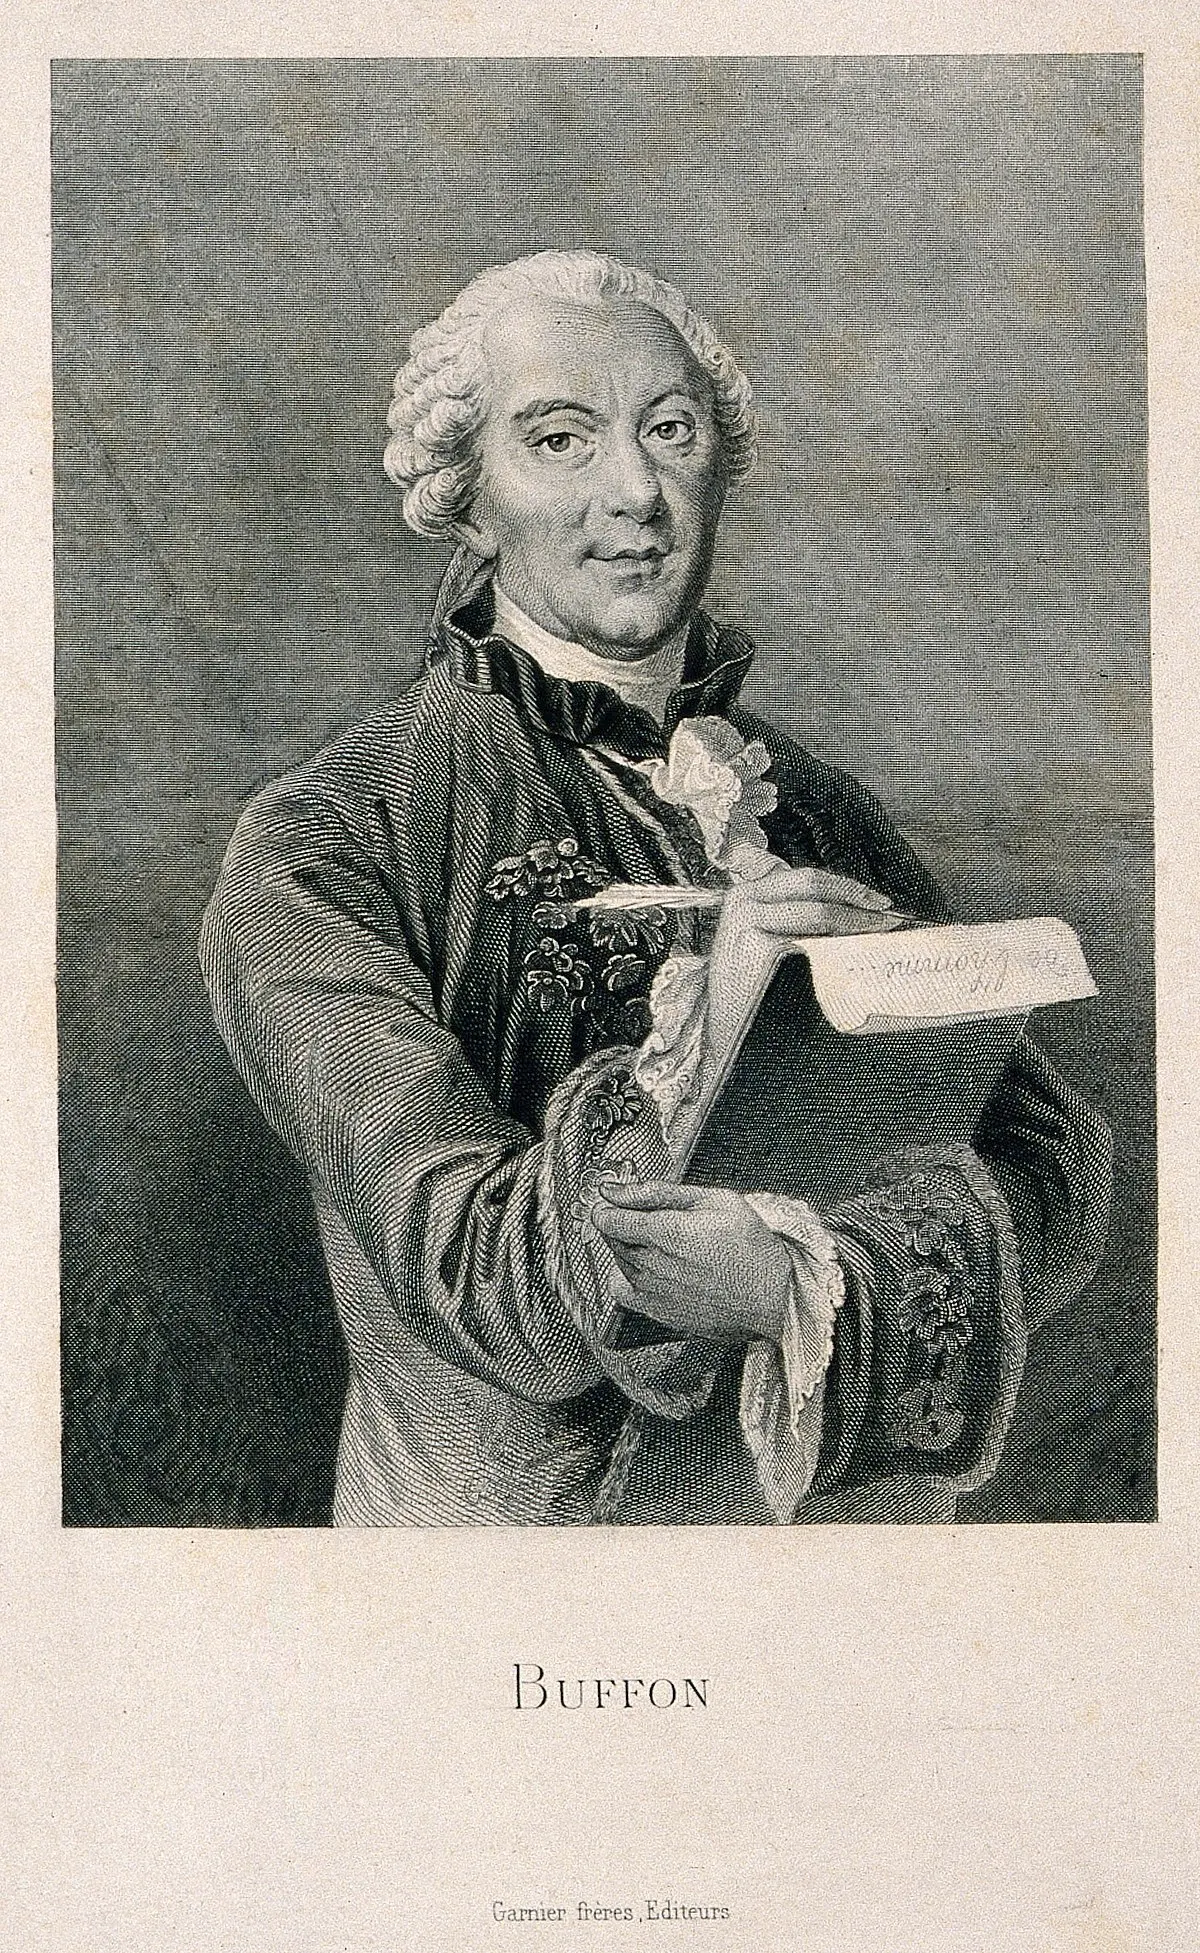
Georges-Louis Leclerc, better known as the Comte de Buffon, was born in 1707 in the Burgundian town of Montbard. His father, a lawyer grown wealthy on the salt tax, wanted his son to become a lawyer too. The son instead grew fascinated with mathematics, botany, and the idea of cataloguing the entire world. In 1739 he became director of the Royal Garden (the Jardin du Roi) and devoted the rest of his life to a single colossal project: Histoire Naturelle. Thirty-six volumes appeared in his lifetime, the encyclopedia became one of the most widely read works in Europe, and it made Buffon one of the most famous scientists of his age.
Buffon was also a man of style. The line he delivered in his 1753 induction speech to the Académie française is still quoted in writing classes today: “Le style c’est l’homme même” — style is the man himself.2 That a naturalist’s sentence still hangs on the wall of everyone who thinks about writing, two hundred and fifty years later, tells you what kind of mind Buffon was.
The needle problem is the work of his mathematician’s side. In 1733, at just twenty-six, Buffon presented a paper to the Paris Academy of Sciences on a gambling game called franc-carreau. The game was simple: a coin is tossed onto a floor of square tiles, and the thrower wins if the coin lands entirely inside a single tile. Buffon asked: how large must the tile be for the game to be fair? To answer, he did something no one had done before — he brought geometry into probability. Instead of the countable outcomes of dice and cards, he computed probability as a ratio of areas over infinitely many positions and angles. The field we now call geometric probability was born with that paper.
Right at the center of a problem with no visible tie to circles, π is sitting.
Because the circle is hidden inside the angle through which the needle turns as it falls.II · The Problem
The Question Itself: One Needle, Infinite Parallel Lines
Let us state the problem in modern terms. In the plane there are infinitely many parallel lines, spaced a distance d apart. We toss a needle of length L onto this plane entirely at random: the needle’s center lands at a random spot, and its orientation takes a random angle. For now assume the needle is short: L ≤ d. In that case the needle can cross at most one line.
Buffon’s claim: the probability that the needle crosses a line is
The prettiest special case is L = d: if the needle is exactly as long as a plank is wide, the crossing probability is 2/π ≈ 0.6366. Roughly sixty-four out of every hundred tosses touch a line. If the needle is half-length (L = d/2), the probability becomes 1/π ≈ 0.3183; we will use this ratio in the simulation shortly, because then the estimate of π takes its simplest form — you just divide the number of tosses by the number of crossings.
III · The Derivation
The Whole Calculation: Two Variables, a Sine, an Integral
Now let us derive the formula from scratch. As promised, I will skip no step.
Two numbers completely fix where the needle lands:
First, the perpendicular distance from the needle’s center to the nearest line. Call it x. By the definition of “nearest,” x takes a value between 0 and d/2, and because the toss is random it is uniformly distributed over that range.
Second, the acute angle the needle’s direction makes with the lines. Call it θ. By symmetry we can squeeze θ into the range 0 to π/2, and it too is uniform there. This is exactly the moment π slips onto the stage: the instant you start measuring angles, whether you like it or not, you have invited π into the calculation.
When does the needle cross a line? Half of the needle’s projection perpendicular to the lines is (L/2) · sin θ. If the center is closer to the nearest line than that projection, the needle touches it. So the crossing condition is:
The problem has now become a calculation of areas. All possible outcomes are the points of a rectangle whose horizontal axis is θ (from 0 to π/2) and vertical axis is x (from 0 to d/2). The rectangle’s area is (π/2) · (d/2) = πd/4. The points that correspond to a crossing are those below the curve x = (L/2) · sin θ. The area of that region is a simple integral:
The probability is the ratio of the favorable area to the total area:
That is all of it. One sine, one integral, one ratio. High-school senior mathematics is enough to yield one of the most elegant results of the eighteenth century.
IV · Where \u03c0 Comes From
What Is \u03c0 Doing in There?
There is no circle in sight, no arc. So where did π come from? The answer is in the needle’s rotation. When you toss the needle it does not merely land somewhere — it also chooses a direction. Choosing a direction is choosing a point on a circle. All the orientations the needle can take are like the diameters of an invisible circle centered on it. π seeps into the calculation from that invisible circle.
There is another way to see it, and to my taste an even lovelier one: the average projection. The expected value of a randomly oriented needle’s projection perpendicular to the lines works out to (2/π) · L. So π is hiding here in the answer to the question, “how long is the average shadow of a randomly rotated rod?” Buffon’s needle pries π loose not from the circumference of a circle but from the geometry of random rotation. This view also opens the door to integral geometry, which we will reach shortly.
V · Reverse Engineering
Turn the Formula Around: Hunting \u03c0 With a Needle
The formula’s real fame lies in reading it backwards. Toss n needles, count the h that cross a line. By the law of large numbers the ratio h/n approaches 2L/πd. Solve the equation for π:
What lets us trust this estimate is the law of large numbers, whose simplest form Jacob Bernoulli proved three centuries ago: however unpredictable the individual tosses, as the number of tosses grows the crossing frequency stabilizes and settles around a single value. In the nineteenth century, when probability theory was still treated as a semi-empirical science, this experiment was carried out for real, and scrupulously. The table that entered Gnedenko’s classic textbook on probability reads like the official register of needle-tossing history:4
| Experimenter | Year | Tosses | Experimental π |
|---|---|---|---|
| Wolf | 1850 | 5,000 | 3.1596 |
| Smith | 1855 | 3,204 | 3.1553 |
| Fox | 1894 | 1,120 | 3.1419 |
| Lazzarini | 1901 | 3,408 | 3.1415929 |
| True value of π to the seventh decimal place | 3.1415927 | ||
Reading the table top to bottom is like reading a thriller whose tension keeps ratcheting up. Wolf’s and Smith’s values deviate from π by 0.01–0.02, perfectly reasonable for a few thousand tosses. Fox’s deviation of just 0.0003 with only 1,120 tosses is surprisingly good; luck plays a large role, but it is still possible. Lazzarini’s value, though, is a mere 0.0000002 above the true value. A miracle. Or so it seems; we will come back to it.
First, the mathematics of the slowness. The error of this estimator scales as 1/√n: to improve the accuracy by a factor of N you must increase the number of tosses by a factor of N². According to Zaydel’s detailed analysis, when the needle length is close to the line spacing, the accuracy you can reliably expect for π after n tosses is:8
Put in numbers, the picture sharpens. Getting the error below 0.02 requires about twelve thousand tosses. A single toss — picking up the needle, flipping it, dropping it, looking, writing it down — takes roughly five seconds; a ten-thousand-toss experiment comes to about fourteen hours, two full working days. Want ten times the precision, and the time balloons a hundredfold, to two hundred days. This is why getting 3.1 is easy but prying loose the next digit, 4, is much harder. To reach Lazzarini’s reported precision of 0.0000002 by this route, you would have to toss the needle for roughly four million years. Had he started in 1901, he would today be as far from his published result as he was on the first day.
Buffon’s needle is not a calculator but a demonstration of principle: proof that randomness can measure a deterministic constant. The Monte Carlo methods developed in the mid-twentieth century at Los Alamos to compute neutron diffusion are precisely the descendants of this principle.
VI · Error
Weighing a Match on a Railroad Scale: The Inevitability of Error
Statistics is not the only obstacle. To extract π from the formula you must measure L and d, or rather their ratio, precisely. A fifty-millimeter needle can be measured with calipers to an accuracy of at best 0.1 millimeter, which is a two-in-a-thousand error. With more sophisticated instruments you reach 0.01 millimeter, and there you hit the practical wall. Going down to 0.001 millimeter is nearly impossible, because a swing of even one or two degrees in the ambient temperature changes the measured lengths on that scale. Add the needle flexing on each landing, its tip wearing down, the surface itself deforming. And on a small fraction of the tosses the needle’s tip lands within 0.1 millimeter of a line, where the naked eye cannot even decide whether it crossed.
Zaydel’s verdict is merciless: this experiment cannot pin down π to better than 0.2 to 0.02 percent. The best you can expect with ordinary instruments is π = 3.141 ± 0.006; in a setup built with the utmost rigor, π = 3.1416 ± 0.0006. Expecting eight decimal places out of this experiment is, in his own comparison, like trying to weigh a match on a railroad scale: the scale is sound, but far too crude for the job.8
From this follows a rule of honesty that holds for every measurement: compute the accuracy first, then write the result to only that many digits. If you measured 2.474329 with an instrument accurate to one percent, the honest form is 2.47; the rest is the calculator’s ornament, and once it goes into a report it lends the experiment a precision it did not earn. By this measure, back in the table above, the honest form of the first two rows should have read 3.16 and the third 3.14. Digit inflation is the most innocent but most common form of fraud.
There is also a subtler source of error: the theoretical formula assumes that all positions and angles the needle can take relative to the lines are exactly equivalent. The precise statement of this is given through Figure 02: the probability that a point falling inside the rectangle lands in a small square must depend only on the square’s size, never on its position; in the figure, the probabilities of landing in squares K₁ and K₂ must be equal. In a real experiment, a needle tossed with the habits of a hand and wrist is unlikely to achieve this flawless impartiality. Between the π on paper and the needle on the table sits a gap no one has ever fully closed.
VII · The Experiment
Toss It Yourself: Live Simulation
On the floor below, the line spacing is d and the needle length is L = d/2. With this ratio the crossing probability is 1/π, so the estimating formula collapses to its simplest form: π ≈ number of tosses / number of crossings. Press the buttons and watch with your own eyes how the estimate swings and how slowly it settles. That the third decimal is still trembling even after a thousand tosses is the 1/√n law above, made visible.
VIII · The Scandal
The Lazzarini Affair: A Result Too Good to Be True
Now we reach the most delicious part of the story. In 1901 the Italian mathematician Mario Lazzarini announced that he had performed Buffon’s needle experiment. He had tossed the needle 3,408 times and obtained the well-known approximation 355/113 for π, accurate to six decimal places.5 In his experiment the line spacing was 30 millimeters and the needle 25 millimeters; in 3,408 tosses he counted 1,808 crossings and arrived at π ≈ 3.14159292.
3.14159292. The true value is 3.14159265. Six decimal places from a little over three thousand tosses. We saw above what such accuracy requires: hundreds of millions of tosses. Either Lazzarini was the luckiest man in history, or something else was going on.
Something else was going on. Doubts began with the publications of Thomas O’Beirne and Norman Gridgeman in the 1960s, and Lee Badger published the definitive analysis in Mathematics Magazine in 1994.6 The trick had three layers, each one elegant in its own right:
Layer one: the choice of ratio. Lazzarini made the needle length exactly 5/6 of the line spacing. In that case the crossing probability is 5/3π and the estimate becomes π ≈ 5n/3h. If you catch exactly 113 crossings in 213 tosses, your estimate comes out exactly as 355/113 and you can report π accurate to six decimal places. If it doesn’t work, you do another 213 tosses and hope for 226 crossings in total; if not, you repeat as needed.
Layer two: the fingerprint of the numbers. 355/113 is no random fraction. Discovered in the fifth century by the Chinese mathematician and astronomer Zu Chongzhi, and known in the Chinese tradition as Milü, this fraction is the closest to π of all fractions whose numerator and denominator have fewer than five digits. Look at the numbers Lazzarini reported: 3,408 = 213 × 16 and 1,808 = 113 × 16. In other words the “experiment” was stopped at a multiple of 213 that produces exactly the target fraction. His having performed 3,408 = 213 × 16 tosses strongly suggests this was the strategy he used.
Layer three: the fragility. The result balanced on a knife’s edge. Increase or decrease the number of crossings by one, and the estimate swings to 3.1398 or 3.1433. The fate of a single needle is the whole difference between a six-digit miracle and an ordinary result. Stumbling onto such precision in a real experiment is practically impossible. Moreover, a statistical analysis of Lazzarini’s intermediate results showed that the probability of staying so close to the expected value throughout the experiment is extremely low, which strengthens the possibility that the experiment was never physically performed and the numbers were invented to fit expectations.
Lazzarini’s sin was not tossing the needle, but knowing in advance when to stop.
An experiment whose outcome is known is no experimentSo was this outright fraud? The physicist A.N. Zaydel put the question in the very title of his article for Quantum: delusion, or fraud?8 Zaydel judged deliberate deception unlikely. By 1901 the law of large numbers was common knowledge, any mathematician of the day could have done the error estimate above, and the scientific community never took the result seriously despite its being reprinted a number of times. Zaydel’s guess: Lazzarini most likely computed π after every toss and cut the experiment off at the 3,408th, where the value landed dead on. The probability of catching such a hit even once by chance within ten thousand tosses is on the order of one in a thousand — small, but not zero. If that is what happened, Lazzarini deceived himself before he deceived anyone else. Zaydel’s diagnosis still belongs on every laboratory door: overweening ambition makes a researcher find what he wants to find. The remedy is plain — do not publish a result you cannot reproduce in an independent series.
Badger’s statistical analysis pulls the rope toward fraud, Zaydel toward self-deception. Where the two meet is the real lesson: selective stopping and intermediate results that fit expectations too well are shades of the same sin. The Lazzarini affair is taught today in statistics classes as the textbook example of confirmation bias, and the man’s name did enter the history of mathematics — but not for the reason he wanted: not as the person who best measured π, but as the eternal example of how not to trust data.
IX · Generalization
From Needle to Noodle: Barbier\u2019s Theorem
In 1860 the French mathematician Joseph-Émile Barbier looked at the problem from an angle that turned the question into something else entirely.7 Barbier asked: does the needle have to be straight?
Bend the needle, curve it, twist it into a noodle. Toss any curve of total length L onto the floor. The crossing probability no longer fits a simple formula, because a bent wire can cross a line more than once. But the expected number of crossings — the average number of times it will be crossed — is, astonishingly, entirely independent of shape:
The idea of the proof is one of the loveliest “free lunch” arguments in mathematics: chop the curve into tiny straight pieces. Expectation is additive, each tiny piece’s expected crossing contribution is proportional only to its own length, and how the pieces sit relative to one another does not affect the expectation at all. Sum the pieces, the shape vanishes, and only the total length remains. The literature rightly calls this generalization Buffon’s noodle.
From this observation Barbier drew another theorem, one that now bears his name: the perimeter of every curve of constant width is π times its width. A curve of constant width is a shape that gives the same distance no matter which direction you squeeze it between two parallel rulers. The circle is one, but not the only one: the Reuleaux triangle, with its rounded corners, is also of constant width, and Britain’s heptagonal 20- and 50-pence coins are designed on exactly this principle so that a vending machine measures the same width whatever angle it swallows the coin at. Barbier’s theorem says that all these shapes are “as round as π” in their perimeter, circle or no circle. And its proof runs through needle-tossing: drop a constant-width shape on the floor, compute the expected crossing two ways, set the two equal, and the perimeter formula falls into your lap.
X · The Long Needle
What Happens When the Needle Is Longer Than a Plank?
Buffon’s formula holds for L ≤ d. If the needle is longer than the line spacing, the expression 2L/πd exceeds 1 and stops being a probability. The trouble is in the last step of the derivation: the crossing condition x ≤ (L/2) · sin θ is still true, but since x cannot exceed d/2, a crossing becomes certain at large angles. In the phase-space picture: the sine curve punches through the ceiling of the rectangle, and in the region where it breaks through, the area is clipped at the ceiling. Recompute the integral with this clipping and out comes the long-needle formula:
Checking the formula is easy: set L = d and arcsin(1) = π/2 while the square root vanishes, so the expression reduces to 2/π and meets the short-needle formula exactly at the boundary. As L tends to infinity the probability approaches 1 but never quite reaches it; however long the needle, there is always a chance it falls exactly parallel to the lines and slips between all of them — a chance whose measure is simply zero.
XI · The Legacy
From Tabletop to Laboratory: The Needle\u2019s Two-and-a-Half-Century Career
Buffon’s needle was born as a parlor amusement but became the ancestor of two whole disciplines.
The first we have named: Monte Carlo methods. This needle is the first working instance of the idea of computing a deterministic quantity by random sampling. The family tree of every simulation running today, from a bank’s risk model to a game engine’s lighting, traces back to Buffon’s wooden floor.
The second is less known but no less deep: integral geometry and stereology. Barbier’s observation that “the expected crossing is proportional to length” became, at the end of the nineteenth century, the Crofton formula: you can measure the length of a curve by counting the random lines that cross it. This idea became one of the basic tools of scientists at the microscope. A researcher wanting to measure the total length of a vascular network in a tissue section, the density of fibers in a material, or the membrane surface in a cell lays a ruled grid over the sample, counts the crossings, and computes the length back out with the descendants of Buffon’s formula. A game a count once played on his floor is, two hundred and fifty years later, a routine measurement technique in pathology labs.
What I love most in this problem is this: the needle reconciles two opposite temperaments of mathematics in a single story. On one side π, the symbol of exactness; on the other, pure randomness. Buffon showed the two are not enemies — listen to randomness patiently enough and it whispers the most famous constant of exactness back to you. Lazzarini is the other face of the coin: try to whisper your own answer back to randomness, and mathematics eventually throws it in your face. That someone would notice 3,408 is divisible by 213 was only a matter of time. Those who want to see the principle animated visually will find a fine introduction at Seeing Theory, Brown University’s interactive probability primer.
Sources and Notes
- 1.The modern birth of the Monte Carlo method dates to the 1940s work of Stanislaw Ulam, John von Neumann, and Nicholas Metropolis at Los Alamos; Buffon’s needle is cited in the literature as the oldest known precursor of the approach.
- 2.Buffon, Discours sur le style, induction speech to the Académie française, August 25, 1753.
- 3.Buffon, G.-L. Leclerc, Comte de. Essai d’arithmétique morale, Supplément à l’Histoire Naturelle, vol. 4, Paris, 1777. The needle problem first arose in the 1733 franc-carreau paper to the Paris Academy of Sciences; the full solution appeared in 1777.
- 4.Table from B.V. Gnedenko’s classic textbook on probability, as reproduced by Zaydel (see note 8). For another survey of nineteenth-century needle experiments see Uspensky, J.V. Introduction to Mathematical Probability, McGraw-Hill, 1937, pp. 112–113.
- 5.Lazzarini, M. “Un’applicazione del calcolo della probabilità alla ricerca sperimentale di un valore approssimato di π”, Periodico di Matematica per l’Insegnamento Secondario 4 (1901), 140–143.
- 6.Badger, L. “Lazzarini’s Lucky Approximation of π”, Mathematics Magazine 67, no. 2 (1994), 83–91. For the early doubts see Gridgeman, N.T. “Geometric Probability and the Number π”, Scripta Mathematica 25 (1960), 183–195.
- 7.Barbier, J.-É. “Note sur le problème de l’aiguille et le jeu du joint couvert”, Journal de mathématiques pures et appliquées, 2nd series, 5 (1860), 273–286.
- 8.Zaydel, A.N. “Delusion or Fraud?”, Quantum (NSTA / Springer-Verlag). The experiment table, the α ≈ √(5/n) accuracy formula, the measurement-error analysis, the four-million-year estimate, and the charitable reading of Lazzarini’s intent are drawn from this article.