Factorization diagrams are representations of numbers made up of dots that are organized according to factors. Brent Yorgey, a Ph.D. student, came up with the idea. Then Stephen Von Worley created this fascinating tool, a promenade of primes, composites, and their constituents, which are arranged with an aesthetically-tuned variation of Yorgey’s rules and displayed one at a time one prime per second.

Prime Factorization Diagrams
SIMILAR TOOLS
A Knot Zoo: Mathematical Knots
A Knot Zoo is an extraordinary digital collection where knots are explored and presented through a mathematical lens. This unique gallery showcases the beauty and complexity of knots using visualization…
Seeing Theory: Simplifying Statistics through Visualization
Seeing Theory is an educational tool that aims to teach the fundamental concepts of statistics through the use of interactive visualizations.
Pop Math
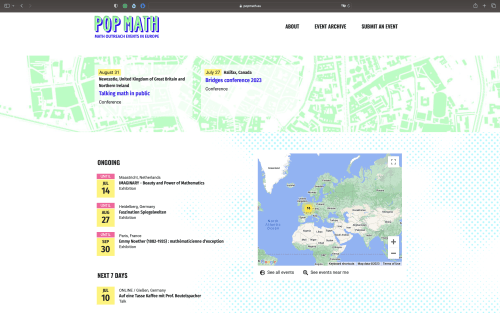
Pop Math is a project that tries to bring together all of the popular mathematics events taking place around Europe on a single map. Events that are focused on mathematics…
Is This Prime?
Do you remember learning about prime numbers in math class? It can be a tricky concept to wrap your head around, but luckily, a fun and educational game can help…
- Education ,
- Mathematics ,
Absurd Trolley Problems
Neal Agarwal, an innovative thinker and game developer, is the creator of Absurd Trolley Problems. The game challenges players to answer trolley problems that increase in absurdity as the game…
- Logic ,
- Mathematics ,
- Neal Fun ,
The Map of Mathematics
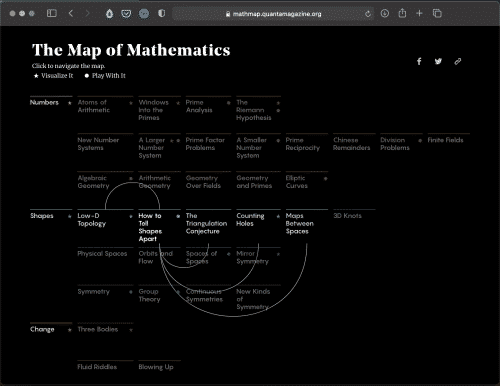
Explore our surprisingly simple, absurdly ambitious and necessarily incomplete guide to the boundless mathematical universe.