Statistics is a branch of mathematics widely used in various fields such as science, business, education, and healthcare. It involves data collection, analysis, interpretation, presentation, and organization. However, despite its importance, many people find it challenging to grasp the concepts of statistics because of the complex mathematical formulas and computations involved. Thankfully, Seeing Theory has come to the rescue with an interactive website that simplifies statistics through visualizations.
Seeing Theory was created by Daniel Kunin, a mathematics and computer science student at Brown University, in collaboration with the Brown University Department of Applied Mathematics. The platform offers 18 interactive visualizations that explain fundamental concepts in statistics, such as probability, random variables, statistical inference, regression analysis, and machine learning. Each visualization includes an explanation of the concept, a graphical representation, and an interactive feature that allows users to manipulate the variables and see the effects of changes in real time.
One example of a visualization on Seeing Theory is the Probability Distribution. This visualization helps users understand the concept by showing the distribution of probabilities over a given range of values. It also illustrates the difference between discrete and continuous probability distributions and highlights the importance of the mean and variance in determining the shape of the distribution.
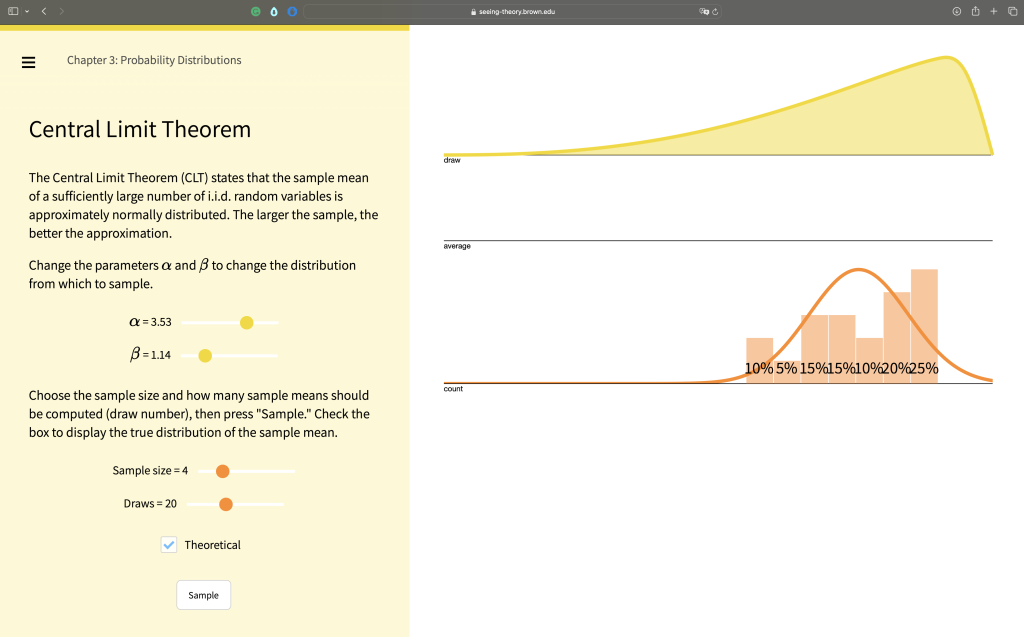
Another interesting visualization is the Central Limit Theorem, which shows how the distribution of means of a large number of independent, identically distributed random variables approaches a normal distribution regardless of the underlying distribution. This theorem is critical in statistical inference and hypothesis testing and forms the basis of many statistical models and methods.

The Regression Analysis visualization is another example of how Seeing Theory simplifies complex statistical concepts. This visualization shows how regression models predict the relationship between two variables, where one is the dependent variable and the other is the independent variable. Users can adjust the slope and intercept of the line of best fit and see how it affects the prediction accuracy.
In conclusion, Seeing Theory has revolutionized the way we learn and understand statistics. With its interactive visualizations, anyone can now grasp complex statistical concepts intuitively. Whether you are a student, a researcher, a data analyst, or just someone interested in learning more about statistics, Seeing Theory is a valuable resource you cannot afford to ignore. So, the next time you need to brush up on your statistics, head over to Seeing Theory and start exploring.


